Posts

Showing posts from January, 2024

Example Regulatory Reporting Scheme Working Prototype: Common Elements of Financial Report

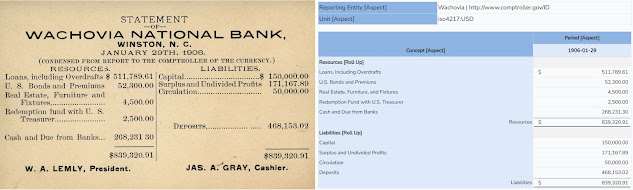
This blog post explains a completely new approach to regulatory reporting.  This prototype uses a very basic, simple example of a reporting scheme to keep this first example easy to explain.  See the "Additional Information" section below for more sophisticated report fragments. This regulatory reporting scheme is created using the Seattle Method framework. To test the framework I created about 35 different reporting schemes. Here is the list which contains pointers to all reporting scheme metadata . Those 35 different reporting schemes were used to test the framework. For this demonstration I will use the Common Elements of Financial Statement (Version 3)  (Four Statement Model) prototype financial reporting scheme.  Imagine that as an example of a regulator reporting scheme. Step 1 would be for a regulator to create and publish their reporting scheme using the XBRL global standard following the good practices specified by the Seattle Method.  That includes publishing all

Getting Started with Auditchain Luca

Image
The Innovator's Dilemma points out that disruptive innovations often look like toys that are doing everything wrong. Auditchain Luca , which is part of the Auditchain Suite , is a unique approach to creating a knowledge graph .  To experience using Auditchain Luca, have a look at the Getting Started with Auditchain Luca instructions. Be sure to grab the Excel and JSON import files used for this getting started exercise.   This getting started exercise uses one of several different approaches to getting information into a tool for constructing and viewing professional quality knowledge graphs .  Additional getting started guides will be made available over time. Auditchain Luca might not make sense to you if you don't understand the paradigm shift that is occurring and if you have not shifted your mental map. For the next step in your journey, consider trying creating a report using a financial reporting scheme template . If you are struggling to figure out how to register or

Levels of a Report

Image
This is my third attempt to explain the levels of a digital financial report. Here is the first attempt .  Here is the second attempt .  This is similar to describing the levels of self driving in order to understand the meaning when someone says "self driving".  Or, see this Wikipedia article, Evaluation Assurance Levels , related to security.  Note the notion of "common criteria certification". The purpose of this is to understand what is meant by the term " logical twin " (a.k.a. logical digital twin).  Below is my third attempt at defining the levels of a general purpose financial report. Level 0 (Information provided physically) : Not machine readable. An example of Level 0 is a clay tablet, papyrus, or paper as the report medium. ( Example , imagine that this example is on paper.) Level 1 (Information provided digitally) : Machine readable, structured for presentation of the information, information metadata is nonstandard. (Examples: PDF , HTML , JP

Notion of the "Semantic Hive" or "Hive Plot"

Image
Someone was explaining something to me and they used the term " semantic hive ".  This blog post explains what I think a semantic hive is.  It could be the case that they are using that term "semantic hive" to describe something different; but I believing that what I am describing is necessary. Another term for what I am trying to describe is " hive plot ". To create a problem solving system you need to be sure to include all of the pieces of that system.  One of those pieces is the knowledge from some area of knowledge.  Users of that knowledge need to be committed to that knowledge  in order for the system to work the way they want/need the problem solving system to work. But reality can get very messy.  The Cnyfin Framework , which is a sensemaking tool, helps one organize an area of knowledge into categories.  Those categories are: Best practices : things that tend to be obvious even to people outside an area of knowledge. There tends to be only one

Logical Twin of Financial Statement

Image
As I have previously pointed out, there is a difference between "digitisation" and "digitalisation" : Digitisation involves converting data from an analogue to digital format (e.g. taking a paper report and converting it to a pdf). Digitalisation , on the other hand, is about transforming entire business processes to be digital. It is about using technology to change the way that business-as-usual is conducted. To effectively transform an entire process,  one needs to understand the difference between the notion of a "digital twin" and the notion of a "logical twin". A digital twin is digital model of an  actual real-world physical system that serves as the effectively indistinguishable digital counterpart of that physical system. For example, representing information in RDF could be considered a digital twin.  But how do you know that what was represented within the RDF is right? A logical twin  (a.k.a. logical digital twins) takes the notion o

Solving the Problems of "Accidental Taxonomists" and "Data Janitors"

Image
There is an article and a presentation by Mike Dillinger  that points out very important information about real people working with knowledge graphs.  Those two pieces of work are: Taxonomies: Trying to Connect Data with Duct Tape Better Taxonomies for Better Knowledge Graphs The first article provides a summary, a "foundation for success" that includes three key points that would lead to better "taxonomies" or knowledge graphs.  Those three key points are: (with me paraphrasing a little) People : We need to move beyond leaving knowledge creation to naïve non-practitioners (area of knowledge subject matter experts); semantic training programs are necessary to create the essential talent required to create quality knowledge representations. Process : We need to move beyond simply improvising; we need industry good/best practices to follow. We need to create proven, tested frameworks using good/best practices that are proven to provide reliable results dependably; ove

BREL

BREL (Business Reporting Extensible Library)  is a new Python library for reading XBRL-based digital reports. BREL was created by Robin Schmidiger , a student pursuing a Masters in Computer Science at ETH Zurich .  BREL is his thesis project  which was supervised by Ghislain Fourny who is the author of The XBRL Book . BREL is free and open source.  Currently it is an alpha.  You can get more information here: Link to PIP Install Documentation Examples GitHub repository Open issues Master's Thesis I am working on making sure BREL passes my XBRL-based digital financial reporting conformance suite , is consistent with the Seattle Method , and supports the Standard Business Report Model (SBRM). Additional Information : Arelle (fully compliant open source XBRL processor) PY-XBRL

Expanded Accounting Oracle Machine Ideas

I mentioned the notion of an accounting and reporting oracle machine .  This post expands on that vision.  Here are some key aspects of that vision.  First, here are two of the primary financial reporting scheme XBRL taxonomies: US GAAP XBRL Taxonomy  | US GAAP XBRL Taxonomy Prototype IFRS XBRL Taxonomy  | IFRS XBRL Taxonomy Prototype The SEC uses both the US GAAP and IFRS XBRL taxonomies.  In addition, the SEC provides an RSS feed that points to all filed XBRL reports: Standard Taxonomies Structured Disclosures RSS Feeds Monthly RSS feeds provided Fundamental accounting concepts used by US GAAP and IFRS: Fundamental accounting concepts Key financial ratios (prototype) Conceptual framework for financial reporting: US GAAP, SFAC 8, Elements of Financial Statements High level concepts knowledge graph Essence (high level financial reporting concepts) Other Prototype Financial Reporting Schemes: Personal Financial Statements Not for Profit Financial Reporting (US GAAP) International Publi

Experimenting with Turtle

Image
I am going to bite the bullet and start fiddling around with RDF Turtle .  Using this RDF turtle visualization tool , I was able to pretty quickly represent some information about the accounting equation using RDF turtle.  This short video shows you how to use that tool. This RDF Turtle validator checks to see if my syntax is correct. Here is the RDF turtle that I entered for the accounting equation. This is the visualization that was generated: Something that only your mother could love...but it is a start! Every journey starts with the first step. Everything else is a detail. (FYI, this is the accounting equation represented using XBRL ) Here is the second project, SFAC6 Elements of Financial Statement specified by the FASB . ( Same thing represented using XBRL ) Here is the third project, Common Elements of Financial Statements using RDF Turtle ; Using XBRL . The next step is to represent my PROOF in RDF. Additional Information : Logical Theory Describing Financial Report PROO

Two AASB 1060 Reports to Fiddle With

Image
For accountants who are interested; here are two AASB 1060 (Australia Accounting Standards Board  General Purpose Financial Statements – Simplified Disclosures for For-Profit and Not-for-Profit Tier 2 Entities ) financial reports that you can fiddle with.  AASB 1060 is similar to IFRS for SMEs.  Here is about, I don't know I will say 20%, of an XBRL taxonomy created for AASB 1060 that is (a) properly created and (b) complete for that 20% that is provided. I created a bunch of reports, but I will provide TWO that accountants can fiddle with below. Each of these reports contains the IMPORT files you can use to create the reports for yourself using Auditchain Luca , the XBRL that was output, an HTML rendering, a PDF rendering, and a few odds-and-ends: Primary Financial Statements with Numbers : ( Pacioli Verification Result ; note that not all the rules were used to verify report) Full BSN-ISF Financial Statement with Placeholder Values : ( Pacioli Verification Result ; note that the

HL7 FHIR is an Example of Leadership in Action

Image
Fast Healthcare Interoperability Resources ( FHIR ), per their website, is a next generation standards framework created by HL7. FHIR combines the best features of HL7's v2 icon, HL7 v3 icon and CDA icon product lines while leveraging the latest web standards and applying a tight focus on implementability. FHIR is a standard for health care data exchange, published by HL7.  FHIR is an example of leadership in action . This FHIR summary page helps to understand what exactly FHIR is and what they are trying to accomplish. This FHIR modules page is also incredibly insightful.  These are FHIR resources .  Here are FHIR patterns .  They have a certification program . HL7 fundamentals course . This six minute video, HL7 FHIR: What is it, Really? These same ideas can be used for digital business reporting.  Think modern spreadsheet . Somewhat of a "digital Swiss Army Knife". So FHIR stands for "Fast Healthcare Interoperability Resources".  OK.  How about "Finan

Professional System for Creating Financial Reports Leveraging Knowledge Graphs

Image
The document Professional System for Creating Financial Reports Leveraging Knowledge Graphs explains a new approach, a new paradigm, for creating financial reports.  The document provides a practical, nontechnical description of a professional system for creating provably high-quality financial reports where the report creator is using financial reporting schemes (such as US GAAP and IFRS) where report creator is permitted to modify the report model which leverages global standard knowledge graphs represented using XBRL. This new approach is useful, it is highly novel, and the details were highly complicated to pull together.  This is certainly not an incremental innovation.  It is definitely a disruptive innovation and it could very well be a foundational innovation. You can decide which for yourself. Foundational technologies have two dimensions that need to be considered: novelty and complexity. The more novel the technology is, the more effort needed to ensure users understand the