Posts

Showing posts from July, 2023

Fool me Once

Image
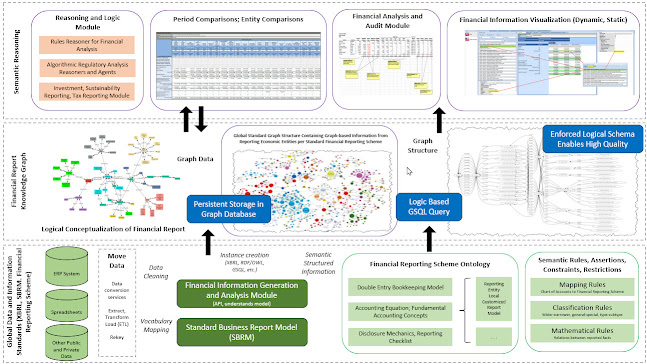
As the book, Fool Me Once: Scams, Stories, and Secrets from the Trillion-Dollar Fraud Industry , points out,  "Where there are people, there is fraud."  As this Forbes article,  22 years after the $63 billion Enron collapse, a key audit review board finds the industry in a ‘completely unacceptable’ state , point out; audit is out of control and the situation is "completely unacceptable" per the PCAOB. Here is the statement by Chair Erica Williams on the "Rise in Audit Deficiency Rates .  Here is the PCAOB 2023 staff report on inspection observations . The volume and complexity of information associated financial reporting and financial auditing is mismatched with the tools available to accountants and auditors.  I have shown the possibility of more modern and professional tools , tools that are more appropriate for the information age.  All this is going to get worse before it gets better.  I have built some working prototypes of such such tools like this XBRL-

Knowledge Graph System for Financial Reporting

Image
The graphic below is an improved version of a similar graphic that was inspired by a graphic in a paper published by the IEEE related to electronic health records ( see here ). As The Great Transmutation of Financial Accounting, Reporting, Auditing, and Analysis points out; the world is transitioning from older approaches to some newer more modern approaches for the universal technology of accountability .  We are not yet were we are going to be, but the status quo is definitely doomed and there is no going back.  The flywheel is turning faster and faster.  No one, not even me, understands exactly how all this will unfold.  But there is one thing that is certain: change is inevitable. This graphic explains my personal opinion about how the future might work.  It is based on my 20+ years of trying to figure this out.  I was not distracted by things like the mandated use of XBRL by regulators.  I took a different path.  I embraced the complexity and tried to understand the complexity

Knowledge Graph System

Image
We go through life accumulating knowledge and put that knowledge into your minds, contextualizing that accumulated knowledge for future use.  A knowledge graph is a technology that turns data into machine-interpretable knowledge. This article published by the IEEE,  EHR-Oriented Knowledge Graph System: Toward Efficient Utilization of Non-Used Information Buried in Routine Clinical Practice , uses the term "knowledge graph system" and others have used the term "knowledge graph approach" to describe what I am trying to achieve using the Seattle Method .  The vision provided by that article for electronic health records is similar to what I am trying to achieve for financial reporting. The article has a graphic which explains the system for electronic health records knowledge graph.  I took the liberty to use that framework to explain the knowledge graph system of financial reporting.  Here is that graphic I came up with: ( here is link ) This graphic below from that

PLATINUM Business Use Cases, Test Cases, Conformance Suite

Image
A brick wall is made of exactly two things: bricks, mortar. But a brick wall created by a master craftsman, or mason, and a brick wall created by a “weekend warrior” with no knowledge of masonry will be very different. Master craftsmen are created and that process takes time and effort. This blog post is a first prototype that brings several things together into one useful resource for business professionals.  It pulls together the human readable information of the Showcase of Reports   and the machine readable information of the Conformance Suite of XBRL-based Financial Reports Prepared using the Seattle Method .  Then, I want to incorporate the information found in these PLATINUM XBRL-based Financial Report Examples . The three resources can be useful and used independently; but they are even more useful when used together.  Business professionals really could not care a less about the technical details of getting some result that they want.  But technical professionals need to under

PLATINUM XBRL-based Financial Report Examples

Image
In 1494 Luca Pacioli documented the Venetian Method of double-entry bookkeeping and that documentation was used to implement that best practices method first in Europe and then around the world.  The Seattle Method and Mastering XBRL-based Digital Financial Reporting is my best effort to enhance the Venetian Method for the Information Age. Need a simpler more condensed "jump start".  Have a look at my new Platinum Examples .  See below. Over the years I have created a plethora of examples and samples of XBRL-based digital financial reports.  You can find these on my "lab notebook" ( my older blog ).  The best set of examples are on this specific blob post, " The End (Start Here) ".  The set of "Golden Examples" is what helped me tune the Seattle Method and my contributions to the Standard Business Report Model (SBRM). The set of examples below, what I call my PLATINUM Examples , were explicitly created to follow the very best practices of the

ODOO Open Source ERP Software

Image
Odoo is an open source ERP system. Wikipedia has some very good information about Odoo. This video provides an overview of Odoo.  Odoo provides an extensive education program, educational videos on their YouTube channel , and lots of other resources to help you get started.   You can try Odoo for free.  I set up an account for free, posted a general ledger transaction, and printed a report in a matter of minutes. Odoo holds itself out as being both powerful and easy to use.  I am going to check this out and see what I find. Lots of possibilities here. Additional Information: Zero-Copy Integration Softledger (Cloud Application) Odoo (Cloud Application) Akaunting  (Cloud application) XLedger  (Cloud application)