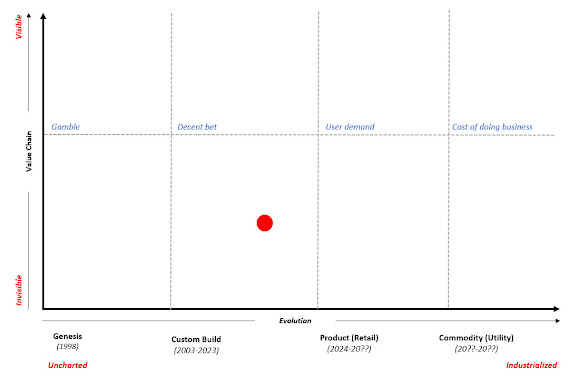
Framework for Predicting Changes to Financial Accounting, Reporting, Auditing, and Analysis

Let's face it. Most people don't yet grasp the transformational changes that are unfolding in financial accounting, reporting, auditing, and analysis. To do so, you need the right combination of skills and experience. Getting that skill and experience is not an insurmountable endeavor. You simply have to gain the skill and/or get the experience. As Malcom Gladwell pointed out, it takes about 10,000 hours to master something. But, "Practice does not make perfect," as is often said. Perfect practice makes perfect. If you practice the wrong things you could become an expert in the wrong area. I have consolidated what I personally believe to be the important moving pieces of the puzzle into related to The Great Transmutation of financial accounting, reporting, auditing, and analysis into the document Evolution of a System - Framework for Predicting Changes to Financial Accounting, Reporting, Auditing, and Analysis . The universal technology of accountabi...