Posts

Showing posts from December, 2023

Relational Knowledge Graph System (RKGS)

Image
Relational Knowledge Graph System (RKGS) is an interesting idea that combines the relational paradigm and the knowledge graph paradigm.  This documentation, Why RKGS , explains the idea. This gets even more interesting with the notion of "relational AI".  RelationalAI is described as follows by the company of the same name, Relational.ai : “RelationalAI is a cloud-based relational knowledge graph management system, with state of the art probabilistic processing and declarative reasoning at scale to make developing Data Applications a superpower for your business.” This notion of knowledge graphs represented in relational databases fits into my belief that knowledge graphs have two aspects: the expression SYNTAX and the logic of what is expressed or SEMANTICS. While the LOGIC of a knowledge graph is always the same regardless of technical syntax used to express that logic; there are many, many different technical syntaxes that can be used to represent a knowledge graph. There

Knowledge Commitment

Per several knowledge engineering text books that I have read, there is this notion of " ontological commitment ". Ontological commitment is a concept used in philosophy, artificial intelligence, and information systems. It refers to the agreement to use a shared vocabulary, associations, and rules in a coherent and consistent manner within a specific context. In simple terms, when you make an ontological commitment, you’re essentially saying “I agree that these things exist in the way we have defined them in our shared understanding and I will use these definitions, associations and rules consistently when we talk about those things.” The same idea applies, in my view, to the knowledge represented in a knowledge graph. What makes an ontology worth committing to?  Also, what precisely is your definition of the term "ontology"?  There are many ontology-like things that could be used for knowledge representation. My personal favorite is the theory.  A theory is a se

Distinction between Bespoke, Made-to-Measure, Ready-to-Wear

Image
When it comes to men's suits; there are three primary types of production and it is very important to understand the differences as pointed out by this article, The Difference Between Ready to Wear, Made to Measure, and Bespoke . Those three types of men's suits are:  ready-to-wear (RTW) or off-the-rack, made-to-measure (MTM), and  bespoke tailoring  or custom tailoring. " Bespoke " means to speak of something.  But that word evolved to describe a category of men's clothing and evolved to describe something as "unique" or "custom" such as custom tailoring as contrast to "ready-to-wear" or "off-the-rack" and "made-to-measure". But there are important subtleties and nuances that must become conscious to properly distinguish between the three categories above.  Ready-to-wear does not necessarily mean low quality and bespoke does not guarantee high quality.  Many factors come into play including your size relative to

Unifying Generative AI, Machine Learning, and Rules-based Systems

Image
In an older post , I mentioned that there were two types of artificial intelligence: rules-based and patterns-based.  I also mentioned that you should use the right tool for the job.  This was before the ChatGPT fad started.  Now it appears that there are three general categories of or approaches to artificial intelligence which are: Generative AI : Generative AI is a subset of artificial intelligence and a type of machine learning that produces new content from existing content.  Generative AI uses large language models (LLMs) and transformers to take natural language and synthesize new information. ChatGPT is an example of generative AI. Patterns-based (machine learning) : Machine learning is a subset of artificial intelligence that uses different types of algorithms that leverage statistics and probabilities to analyze data, learn from that data, and imitate the ways humans learn and then make predictions and informed decisions based on the data. Because machine learning is based

PROOF

Image
My PROOF is used for testing, communicating, helping people learn, making sure things work correctly when representing information in an XBRL taxonomy and XBRL instance to represent the logic of a report model and reported facts. Most people will look at the PROOF and think that it is a toy.  But a knowledgeable observer will understand what the PROOF is and why it is important and useful.  The PROOF was created by reverse engineering thousands of XBRL-based reports submitted to the U.S. Securities and Exchange Commission in mainly US GAAP but also using IFRS.  All those reports "revealed" the logical model of a financial report which I documented . Here is a simple view of the report model . Then, I attempted to build the SMALLEST XBRL taxonomy and report that would exercise 100% of the report logic contained in such financial reports.  The result was the PROOF which effectively proves how XBRL-based reports need to be created in order to be (a) consistent with the XBRL Te

Enablers of New Business Models: Solid Data Pods, NFTs, Smart/Logical Contracts

Solid , per the  Solid Project website , is a specification and a web decentralization project led by Tim Berners-Lee that lets people store their data securely in decentralized data stores connected to the internet called PODS (Personal Online Datastores). Pods are like secure personal web servers for your data. Any kind of information can be stored in a Solid Pod, including XBRL, RDF, PDF, HTML, XLSX.  You control access to the data in your PODS.  You decide what data to share and with whom.  You can revoke access to your information at any time.  Applications use standard, open, interoperable data formats and protocols to interact with the data in your PODS. These capabilities decouple data from applications so that data is organized around individuals rather than one single piece of software. Here is some information about the Solid Project: A Look at the Solid Project Solid - A Better Web (Simply Explained) How does Solid Work? Solid: A Platform for Decentralized Social Applicatio

Seeing Digital Financial Reporting Differently

Image
Why does a butcher create a high level model of a pig?  Well, if you give the different cuts of pig meat a name, that enables a butcher to have a different conversation with customers than if the meat cuts did not have names.  Is there one global standard of pig meat cuts? Apparently not, a quick search of Google shows different graphics , but fairly similar. Cow meat cuts also have names , providing a higher level model of a cow that can be discussed. The quick answer as to why there are names for the different cuts of meat of a pig, cow, and other animals is utility.  Those names provide something that you don't get if the names do not exist. Conversations with others has revealed that I apparently, and uniquely, see XBRL-based digital financial reporting differently than others in four very specific and important ways.  Note that unlike many others; I am not trying to meet some regulatory mandate imposed by some regulator.  What I am trying to do is figure out how to employ XBRL

Mezzanine Level of Digital Business Reporting

Image
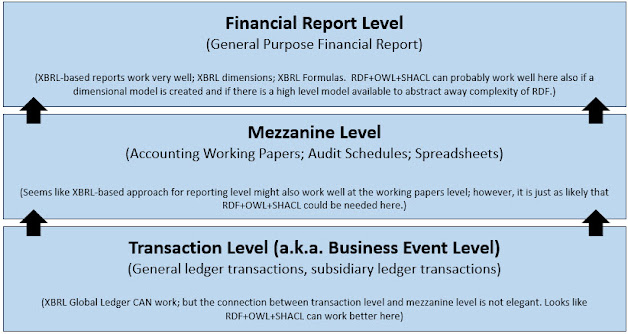
So there appears to be a need for what I am referring to as a "Mezzanine Level" in XBRL-based digital financial reporting.  Financial reports people tend to get; the general purpose financial report .  They also get the level of tractions which XBRL Global Ledger is supposed to handle; it is purpose built for transactional reporting. When you look at the full " record to report " process; in between the transaction level and the financial report level you have accounting working papers and audit schedules that support the financial statement; those working papers and schedules tend to have some characteristics of financial reporting and some characteristics of transactions.  Also, remember that not all information in a financial report comes from an accounting system.  That information tends to originate within electronic spreadsheets and documents.  I call this intermediate middle level the "Mezzanine Level" of the record to report process: Over the yea

Looking at General Purpose Financial Reports Logically

Image
Financial reports are knowledge graphs  which convey the logic of information provided within that financial report.  There is no natural way to represent an economic entity the way it “really is” in the real world; there are just certain purposeful selections of specific aspects of an economic entity, call them abstractions or models, that provide a useful enough simplification that satisfies some specific goal we might have.  Past approaches to representing this logic included stone tablets, paper, and what amounts to "e-paper" (e.g. PDF, HTML).  But now general purpose financial reports can be represented in machine-readable digital format. A problem arises when a knowledge graph of financial report information is less capable masquerades as being more capable or fully capable knowledge graph of meaning.  These less capable knowledge graphs tend to be incomplete representations of reported logic and/or logic represented is inconsistent with the logic of financial reporting

OECD Definition of Artificial Intelligence

The Organisation for Economic Co-operation and Development ( OECD ) is an international organisation that works to build better policies for better lives. OECD has established policies, data and analysis for trustworthy artificial intelligence . OECD has also published a set of principles for trustworthy AI . OECD defines an AI system as: "An AI system is a machine-based system that, for explicit or implicit objectives, infers, from the input it receives, how to generate outputs such as predictions, content, recommendations, or decisions that can influence physical or virtual environments. Different AI systems vary in their levels of autonomy and adaptiveness after deployment." Additional Information : Data Management Implications of AI Act

Explaining Knowledge Graphs Logically

This blog post is a summary of my brainstorming thus far related to explaining knowledge graphs logically (as contrast to technically) to a non-technical person using terminology that they tend to be more familiar with than not. There is a plethora of technical oriented explanations of knowledge graphs provided by others.  For example, here is an explanation of knowledge graphs provided by Big Blue (a.k.a. IBM) : * * * A knowledge graph, also known as a semantic network, represents a network of real-world entities—i.e. objects, events, situations, or concepts—and illustrates the relationship between them. This information is usually stored in a graph database and visualized as a graph structure, prompting the term knowledge “graph.” A knowledge graph is made up of three main components: nodes, edges, and labels. Any object, place, or person can be a node. An edge defines the relationship between the nodes. For example, a node could be a client, like IBM, and an agency like, Ogilvy. An

Atomic Design Methodology

Image
Apparently  there is something that describes the way I am thinking about the Seattle Method and/or the Standard Business Report Model (SBRM) or perhaps maybe this is more about the report itself.  That something is the Atomic Design Methodology . The Atomic Design Methodology is described on the above linked page as: "Atomic design is a methodology composed of five distinct stages working together to create interface design systems in a more deliberate and hierarchical manner."  Atoms are the basic building blocks. Atoms are indivisible elementary building blocks. Molecules are combinations of two or more atoms. These combinations of atoms take on their own unique properties, and become more tangible and operational than atoms. Organisms are assemblies of molecules functioning together as a unit. Organisms are more complex and sophisticated than molecules. Organisms might be constructed from other organisms to create compound organisms . Species : There can be "species&

Evaluating the Quality of XBRL-based Financial Reports

Image
From the time public companies started submitting XBRL-based financial reports to the U.S. Securities and Exchange Commission, I have been looking at those reports, trying to understand the XBRL-based reports, and trying to figure out how to get them right.  That information was used to figure out how to create software applications that help professional accountants get these reports right. Here is information that summarizes my testing and results which I stopped doing March 31, 2019: Analysis of the high level accounting relationships in the 10-Ks of about 5,716 financial reports  (5,063 public companies, about 89.1% got all these high level accounting relationships consistent with expectation, 623 were inconsistent and manual confirmation revealed the inconsistency was an error) Documentation that helps you understand 26 different types of errors in XBRL-based reports High quality documentation of hundreds of errors in XBRL-based reports submitted by public companies to the SEC Doc