Skill to Represent Things Digitally
A critically important skill that some accountants are going to need to have is the capability to represent information digitally. The world of financial accounting, reporting, auditing, and analysis is rapidly transitioning to digital.
Think about something. How is all this "digital" stuff going to play out? A Wardley Map is a sketch of a system. This video, Wardley Mapping in 90 Seconds points out the following:
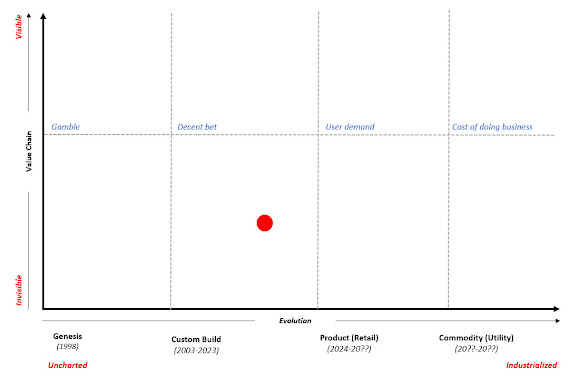
"A Wardley Map is a sketch. Usually of a business, market, or any other kind of work system. It is a design, maybe a blueprint. It might be right, it might be wrong. But it is something we can discuss and refine together on paper to make sure everything we do in reality is as purposeful as it can be. These designs will inevitably be put to the test by the forces of capitalism. No one is exempt; not even governments or non-profits. So, to help us cope, we acknowledge this fact up front by arranging our blueprint by evolutionally stage; from the uncharted where things are uncertain, high failure, and a gamble; to the industrialized where things are known, reliable, and standard practice. Awareness of these qualities helps us approach each part of the system deliberately. No “one size fits all”, only careful specific intention. But the map is only the beginning. Behind Wardley Mapping is a deeper strategic thinking process. There are many patterns to learn, principles to practice, and moves to make. Take it one step at a time for even the smallest insight can change everything."
This graphic embodies what the paragraph above is saying. Contemplate this graphic:
How might XBRL-based digital financial reporting fit into that graphic above? As the video points out, a Wardley Map might be right, and it might be wrong; but it is something that can be discussed on paper. Wardley Maps help the thinking process.
There are lots of different tools for doing that. Here are some of the modern tools that I find particularly useful that are all available in the cloud so it is easy to get started:
- Miro: Visualization and collaboration platform for teams. (Free to get started)
- Mapkeep: Tool for creating Wardley Maps.
- Arrows: Tool for creating knowledge graphs.
- Neo4j: Graph database.
- TigerGraph: Graph database.
- Evolution of a System Graphic
- Neo3j Graph Modeling Guidelines
- Concept Maps
- Higher Order Thinking: Blooms Taxonomy
- The Ultimate Guide to Concept Maps
- Concept Mapping Templates
- The Easy Guide to Process Mapping
- A Concept Mapping Tool to Handle Multiple Formalisms
- Clive's Presentation
- Knowledge Management Booklet


Comments
Post a Comment