Graph Hairball

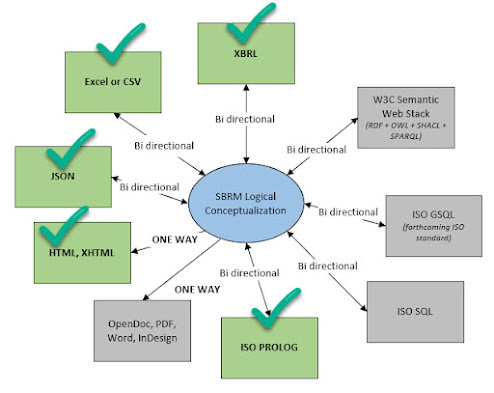
Knowledge graph system logic, the "things" and "relations between things" that graph theory calls "vertices" (a.k.a. nodes, points, entities, things) and "edges" (a.k.a. links, lines, relations, associations), looks like a big graph hairball as some people call it an example of which you can see here: Why? This common view of a graph is because there has to be some "general view" of the information provided by the graph. This is just like a general view of the information within a relational database is a table ; a set of ROWS and COLUMNS for exactly one table at a time. So what is interesting is that with a graph database the default view is everything in the graph of knowledge. Whereas the default view of everything in a relational database is one table at a time. Further, it does not really matter whether the information that populates your knowledge graph comes from, say, CSV files, Excel, JSON, XBRL, RDF, PROLOG or whateve...