Graph Hairball
Knowledge graph system logic, the "things" and "relations between things" that graph theory calls "vertices" (a.k.a. nodes, points, entities, things) and "edges" (a.k.a. links, lines, relations, associations), looks like a big graph hairball as some people call it an example of which you can see here:
Why? This common view of a graph is because there has to be some "general view" of the information provided by the graph. This is just like a general view of the information within a relational database is a table; a set of ROWS and COLUMNS for exactly one table at a time.So how do you solve the graph hairball situation?
Well, you build SPECALIZED TOOLS instead of using the generalized
tools. Now, specialized tools can still give you a graph
hairball….consider this graph hairball provided by Auditchain Pacioli which is
a specialized tool. (You can view the actual graph information here.) This graph visualization provides a semi-modified specialized view using pieces of a logical model. There is more flow and some things are easier to read; but the graph hairball can still be a bit overwhelming. Again, colors and shapes and sizes and filters and slicing and dicing the graph can help you focus on specific areas of the graph hairball and make it less overwhelming; when everything is said and done...you are still viewing a graph hairball.
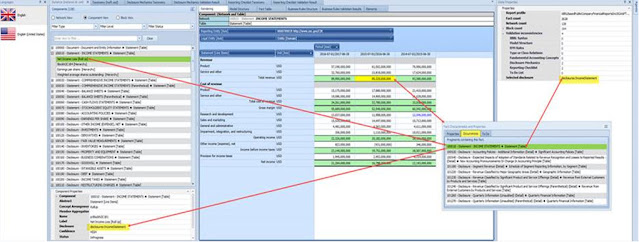
But if a software engineer put in a little more work and leveraged more mature rendering tools of desktop application, then you can get this rendering that was generated using a control for Microsoft.Net (a desktop application) which looks far more appealing to business professionals: (here are more screen shots of a desktop application)
But there is a problem. Desktop applications are falling out of favor as IT people want to make installing software easier and so not cloud-based applications are prevailing over desktop application. Fair enough. But cloud-based GUIs (graphical user interfaces) and UXs (user experiences) are not nearly as mature as the desktop applications that they are replacing. So cloud-based GUI/UX experiences will mature and ARE MATURING. Take the online version of Microsoft Excel as a case in point. But Microsoft has invested millions and millions of dollars perfecting Excel in the cloud. But it has matured….people will copy what Microsoft and others are doing.
Creating software GUI/UXs from underlying logical models is nothing new. The model-view-controller software design pattern is well known and well understood. But software engineers don't seem to understand the "dots" and how to connect all these pieces together. But they will figure it out.
And so, the “graph hairball” will be dealt with. Those that build the best software interfaces (GUI/UX) will prevail. Those that have the best logical models and meta data to drive those specialized GUI/UX interfaces will prevail.
What that software will be rendering is not things like the XBRL technical syntax. The XBRL technical syntax is a physical technical oriented format for moving information from point “A” to point “B”. Some other technical syntax could be used for that, maybe RDF+OLW+SHACL, perhaps GSQL, some will want Excel or JSON. Whatever the syntax, that should not even be a concern of business professionals…they just need the most powerful technical syntax that works reliably.
What business professionals care about is the logical models, like the Standard Business Report Model (SBRM), that drives these sorts of EFFECTIVE GUI/UX interfaces. They are the subject matter experts that must do the work that is performed using the GUI/UX to perform the tasks and processes in the pipeline of work to get their jobs done. These logical models provide the useful view of things like those “nuggets” of information (or infons or Blocks as I call them). Other useful things as well.
Additional Information:
- D3 Gallery (these are all general visualizations)
- FO Dot
- IDP Z3
- XULE
- Large-Graph Layout with the Fast Multipole Multilevel Method
- Syncfusion Pivot Table
- Untangling the Integration Hairball


Visualization of knowledge Graphs. For my Knowledge Builder Server called HyperFrame in 2000, renamed as "HyperPlex" in 2007, I had used Nodes and Links as the building blocks of knowledge. Nodes are stand-alone Concepts represented as rectangular forms. Similarly, Links are block arrow forms with Arrow Heads and Tails. For the sentence "Tom ate an apple". Tom is Subject Node, ate is a Predicate Link and apple is the object Node. The form are have 10 to 20 fields, field importance weights and field values. There are many classes and Sub-Classes of Node Forms and Link Forms. These forms when presented visually, are human readable and within the computer they are software objects which are machine-readable and processible. All adjectives are attribute of Nodes and adverbs are attributes of Links. The form of Links are Predicates, they have many Predicate attribute fields and field values. In general the Links are HyperEdges. They are visually presented as block arrows with multiple tails and multiple arrow heads. The tails and arrow heads correspond to "prepositions". Thus, HyperPlex Nodes and Links are very expressive and vusualizable/machine-processible.
ReplyDelete